Container Shipping: Ship Sizes Keep Increasing Despite Stagnant Volume Growth
18.09.2019Global growth in container volumes has picked up slightly in the second quarter of the year, with growth in the first seven months reaching 1.2%, compared to the just 0.8% in the first quarter.
Demand drivers and freight rates
Despite this rise, the growth figure remains substantially below what the industry has been used to, with growth in the first seven months of 2018 equal to 4.4%.
This low growth figure masks large differences in developments on trades around the world. In particular a 5% rise in exports from the Far East into Europe singles itself out. That high growth should come on this trade is good news for the shipping industry as the large distances lead to a more than proportional increase in tonne-mile demand.
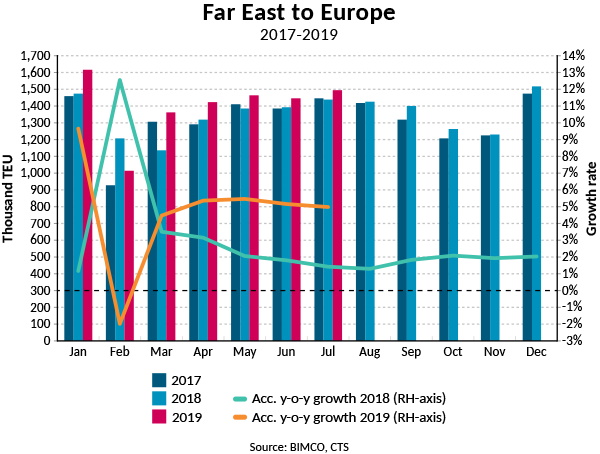
Despite this growth, spot freight rates on the trade between the Far East and Europe have continued to fall. On 30 August spot rates are down 24% from the start of the year and 18.8% from the same week in 2018. The broader China Containerized Freight Index (CCFI), which covers ten ports in China and combines both spot freight rates and long-term rates has a less marked decrease of 7% since August 2018.
Falling rates come despite carriers blanking sailings on the route in an attempt to lift freight rates. Figures from Alphaliner show that 42 sailings were, or will be blanked in the first three quarters of 2019, compared to 16 in the same period of 2018.
Also experiencing high volume growth is the US East Coast (USEC) which year after year continues posting high volume growth. According to BIMCO’s own data, growth in the first half of the year stands at 7.2%, compared with the 7.4% and 10.6% in the first six months of 2018 and 2017 respectively. Despite this, spot rates continue to fall and are down 22.7% year-on-year, so that it costs USD 2,691 per FEU on 30 August to ship a container from Shanghai to the USEC. Taking into account more ports and other contract types, the CCFI has fallen less dramatically, down 4.8% from the same time last August.
High growth rates on both the Far East to Europe, as well as imports into the USEC raises the question whether containers are being sent from the Far East to the USEC through Europe.
In contrast, other major container trades have experienced more sluggish growth. The trade war is certainly making itself felt on the Far East to North America route, where volumes have fallen by 0.4% in the first seven months of the year (Source: CTS). Similarly, laden container imports into the US West Coast (USWC) in the first seven months of 2019 are down 1.5%, according to BIMCO’s own data.
Focusing on Far East container exports, rather than only China gives a better idea of the reshuffling of supply chains that has occurred in response to the trade war, in which China’s neighbours have benefitted from some of its lost trade. Whether containers are exported from China or other Far Eastern countries makes little difference to the container shipping industry, so long as the volumes are still there.
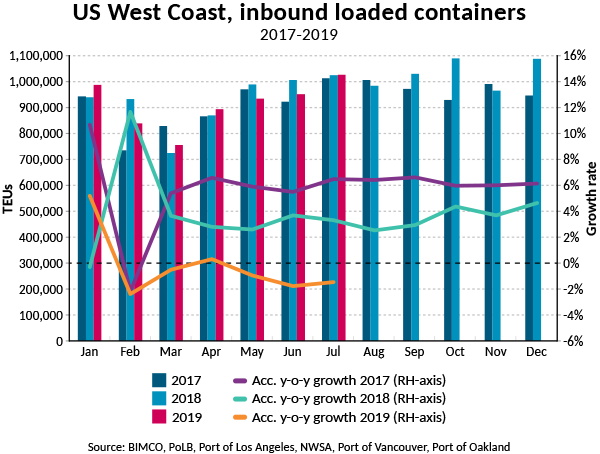
Container imports to the USWC have given a good oversight of the effects of frontloading, with full year growth in 2018 at 4.6% during which imports rose towards the end of the year to avoid higher tariffs. The lower growth in 2019 reflects that the inventory to sales ratio remains high, the implementation of tariffs and uncertainty over the future of the trade war remains significant. The slowdown in 2019 is an inevitable result of the tariffs and stocking up that boosted volumes into the USWC in the second half of 2018.
Another round of frontloading imports has been made possible by US President Trump announcing that around half of the new tariffs on USD 300 billion will have their implementation date delayed from September until December. The delay may be an attempt to limit the impact on consumers over the Christmas period, with the 2020 elections looming. The goods that have been given some extra time are consumer goods of which the majority of US imports come from China. Retailers are therefore likely to stockpile these goods before additional tariffs are implemented, to delay the passing on of additional costs to US consumers. The impact on shipping may be more limited in this latest round given that the goods are mostly high value and low volume goods and therefore have less of an impact on container shipping volumes.
The fall in volumes so far this year to the USWC, has also resulted in falling spot freight rates which are now down 28.9% year-on-year. With rates falling from USD 2,074 per FEU this time last year to USD 1,474 per FEU in August 2019.
As on the USEC, CCFI shows a less drastic reduction than the Shanghai Containerized Freight Index (SCFI), with the index down 1% from August 2018.
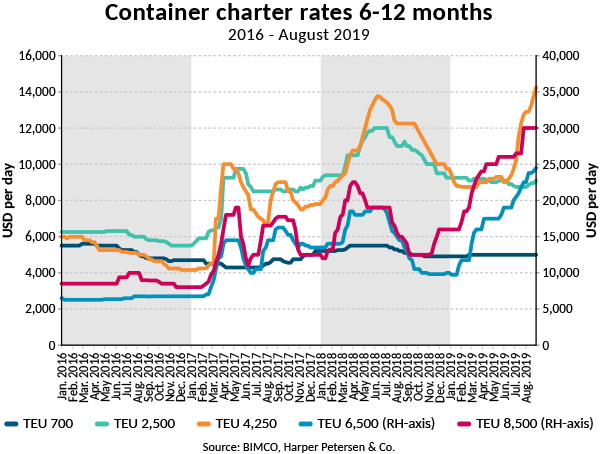
Six to twelve month charter rates for the larger container ships have risen quickly with rates for 6,500 TEU ships being 151% higher (USD 24,500 per day) on 30 August than they were at the start of the year. Charter rates for 8,500 TEU ships are up 88% (USD 30,000 per day). Charter rates for smaller vessel sizes have been very stable over the course of the year, rates for a 700 TEU ship have risen by USD 100 since the start of the year to reach USD 5,000 per day.
Fleet news
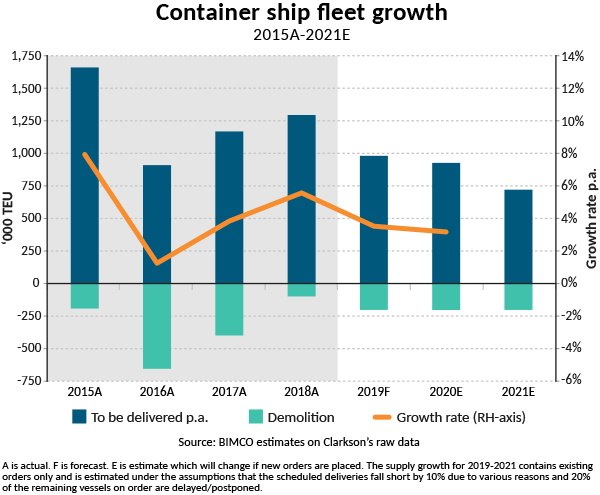
Since the start of the year the container fleet has grown by 2.6% so far this year, a number which BIMCO forecasts will grow to 3.5% by the end of the year. Deliveries include four ships larger than the previous record holding vessel, the first with a capacity of 22,000 TEU which was soon followed by the delivery of two 23,756 TEU vessels and one 23,656 TEU ship.
The size of the ultra large container ship (ULCS) fleet (14,500+ TEU) will only go one way in coming years, as these vessels are piling up in the orderbook with the already active vessels so young that demolition is still a long way off. Of the 165 ULCSs in the active fleet (currently at 22.6 million TEU), only 8 are over 10 years old, whereas 78 have been sailing for two years or less. These vessels are here to stay for the next two decades, and will soon be joined by many more.
There are currently 71 ULCSs on order, amounting to additional capacity of 1.3m TEU with all but four contracted to be delivered between now and the end of 2021. The remaining four are set for 2022. A furthur eleven have recently been ordered by Evergreen, all of which have a capacity of 23,000 TEU.
These ULCSs will be deployed on the Asia-Europe route at a time when freight rates indicate that there is no need for additional capacity, and existing sailings are being blanked despite the 5.2% volume growth rate, indicating that there is no urgent need for these extra ULCSs.
As these newer ships are introduced, cascading of smaller, yet still significant ships will lead to added capacity on smaller routes. As larger ships have arrived on the Far East to Europe routes, Neo-Panamax ships (10,000 – 14,499 TEU) have found themselves being deployed elsewhere, a trend which will continue with larger and larger ships entering smaller trades. Cascading clogs up the balance of these trades where there is currently little demand growth.
On the demolition side, the largest container ship to have left the fleet so far in 2019 had a capacity of only 5,364 TEU. The average size of container vessels sent to a scrapyard this year has been 2,142 TEU. Containership demolition activity picked up in August and is on target to meet BIMCO’s expectation of 200,000 TEU leaving the fleet this year. In comparison, BIMCO expects total deliveries in 2019 of 967,000 TEU.
Outlook
Growth rates on intra-Asian container trades are viewed as an indicator of what is to come on long-haul routes, as volumes here indicate the health of supply chains in the region and therefore what finished goods are likely to be exported from Asia in the near future. With a volume growth rate of 0.8% in the first seven months of 2019, low growth levels can be expected in global demand for container shipping for the remainder of the year.
The continued slowdown in global manufacturing and the broader global economy will impact container shipping. BIMCO expects the GDP multiplier to stay around one for the foreseeable future.
The slowing demand growth means that despite the comparatively low fleet growth expectations which BIMCO has of 3.5%, the fundamental balance of the container shipping market will worsen this year. Furthermore, with the fleet currently projected to grow by 3.2% in 2020 this is unlikely to change much next year, with the industry heading deeper into a hole. Cutting costs will remain in focus to be able to weather the storm.
Adding to the worsening of the fundamental balance, the added fuel costs due to the 2020 sulphur cap, paints a disturbing picture for the rest of the 2019 and 2020 for container shipping. As we have also noted in the dry bulk analysis, the oversupply of capacity is likely to make it difficult for shipowners to recover the additional fuel costs.
Source : Hellenic Shipping News